
While it may be easy to feel content with coverage from your group of supportive sell-side analysts, it is important to consider how this list will evolve throughout the lifespan of your company. For some public issuers, this will happen naturally, but others may need to take a more active approach to keep their sell-side analyst coverage in-line with their industry peers.
Sell-side analysts study publicly traded companies, looking at the historical and current performance, product pipeline, business strategy, and many more factors to predict future performance and make a recommendation on how to classify or trade a stock. Most importantly, these recommendations are considered to be independent, due to the fact that sell-side analysts do not have access to material non-public information, and they do not own the stock. Based on the conclusions from their research, analysts will present a recommendation in a research report, which includes an analysis and an expert opinion about company fundamentals, a financial model with forecasted results, a stock price target, and a stock rating (typically Buy, Hold, or Sell).
Having sell-side coverage can be extremely beneficial to attract investor interest to your stock and company. Whether it is through sell-side research reports, investment bank conferences, non-deal roadshows, or general conversations on Wall Street, sell-side coverage can add value for every public company.
In previous blog posts, we have discussed “How Many Sell-Side Analysts Should Your Company Have?” and “Attracting Analyst Coverage” to discuss these benefits and how to expand your sell-side coverage. Today, we will dig deeper into the data to explore the coverage universe across medical technology stocks, based on market capitalization (or market cap).
To get a better idea why analyst coverage varies across market cap, let’s first discuss a few factors that could make a company attractive to a sell-side analyst.
- Number of years as a public company
- Industry/sector
- Stock exchange (US vs foreign)
- Trading volume (or liquidity)
- Valuation
- M&A
- Banking relationship
To summarize, a long-standing public company in an attractive industry/sector, listed on a US stock exchange, will generally have the largest investor following and therefore warrant a large sell-side coverage. These companies will also have interacted with the most investment banks throughout their lifespan by attending industry and investment bank conferences and completing stock offerings and/or debt financings. On the other hand, a newly public company with a low trading volume (also referred to as low liquidity) may not require coverage from a dozen sell-side analysts.
Let’s take a look at the data from 140 public companies in the Medical Technology sector (source: FactSet).
Before discussing the data, it is important to note that being on the low end is not necessarily a bad thing. Every company is different, and every sell-side analyst and investment bank has a slightly different approach and justification for adding a company to their coverage list. That said, it is always helpful to know how you compare against your peers.
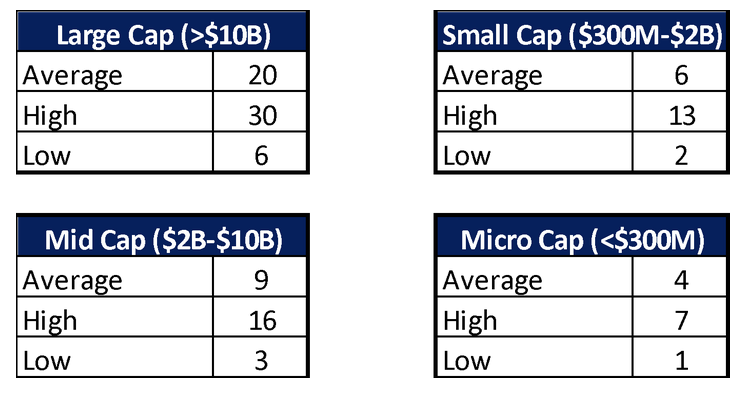
Large Cap (>$10B)
Across the large cap companies in MedTech, the average of 20 sell-side analyst coverage is well beyond that of the other cap sizes. This is simply because companies this size can be recognized throughout the world. With hundreds of thousands to millions of shares traded per day, there is nearly an unlimited demand of information from investors worldwide. Due to these few factors alone, any number of sell-side analysts can easily justify covering the stock if the remaining factors meet the criteria.
At this stage, companies often attract a large number of boutique research firms whose coverage is not tied to investment banking. In these cases, companies have little to no say as to whether the firm picks up coverage but can determine how much they interact with these analysts.
Mid Cap ($2B-$10B)
Within mid cap companies, the natural progression of sell-side coverage from micro-, to small-, to mid-cap becomes clearer. Generally, the increase is tied to improved financial performance, requests from investment bank clients to pick up coverage, or an industry analyst that was not originally involved with the company taking another look at the company. You may also begin to see a few boutique research firms pick up coverage in this window.
Small Cap ($300M-$2B) & Micro Cap (<$300M)
Throughout the small- and micro-cap ranges, it’s common to see a much smaller group of covering analysts and coverage tends be more directly correlated with valuation, banking relationships, and trading volumes.
Among these cap sizes you will often encounter “paid for” research from independent research firms. While adding this coverage can accomplish the same goal of increasing investor awareness, some investors may discount the research due to the nature of the business relationship. Nonetheless, this is another option for companies and management teams to consider.
At Gilmartin, we interact regularly with sell-side analysts and investment banks to help our clients get the best representation possible. If you would like to learn more about sell-side coverage and how to build relationships that grow your coverage, we are here to help! Contact us today.
Hunter Cabi, Associate
Leave a Reply